Fig. 4
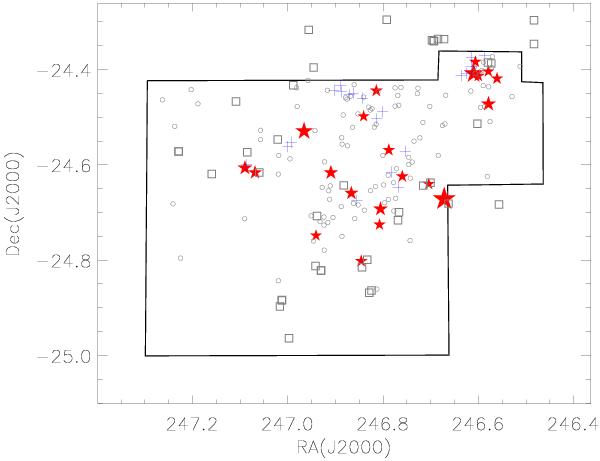
Distribution of outflows in Ophiuchus. The driving sources of outflows identified in this paper are marked with red filled pentagrams whose sizes are proportional to the length of the outflow. The YSOs identified by Evans et al. (2009) are labeled with open gray circles and the millimeter sources identified by Young et al. (2006) are marked with blue pluses. The open gray squares show the distribution of known Herbig-Haro objects (from the SIMBAD database). The region that we have selected for outflow statistical study is outlined with a black solid polygon. Note that for the YSOs and millimeter sources only those that are located inside this polygon are plotted.
Current usage metrics show cumulative count of Article Views (full-text article views including HTML views, PDF and ePub downloads, according to the available data) and Abstracts Views on Vision4Press platform.
Data correspond to usage on the plateform after 2015. The current usage metrics is available 48-96 hours after online publication and is updated daily on week days.
Initial download of the metrics may take a while.