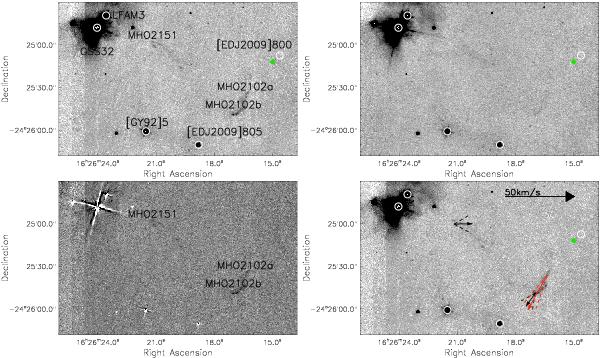
Fig. A.1

Region of MHO 2102 and MHO 2151. Top-left: the H2 image with MHOs and YSOs labeled; top-right: the Ks image for the same region; bottom-left: the continuum-subtracted H2 image with MHOs labeled; bottom-right: the H2 image with the PMs marked. The YSOs from Evans et al. (2009) are marked with white or black circles and the X-ray sources from Pillitteri et al. (2010) are labeled with red crosses. The positions of the sub-millimeter sources from Johnstone et al. (2000) are marked with green filled diamonds and the positions of the millimeter sources from Young et al. (2006) with blue filled squares. The PM vectors of MHOs are shown with arrows and the dashed lines show the errors of PA. The black arrows represent reliable PMs and the red arrows represent uncertain PMs. Source designations used are as follows: [EDJ2009] is from Evans et al. (2009), [GY92] is from Greene & Young (1992b), GSS is from Grasdalen et al. (1973), LFAM is from Leous et al. (1991), YLW is from Young et al. (1986b), BBRCG is from Barsony et al. (1989), WLY is from Wilking et al. (1989), WSB is from Wilking et al. (1987), WL is from Wilking & Lada (1983), and EM*SR is from Struve & Rudkjøbing (1949).
Current usage metrics show cumulative count of Article Views (full-text article views including HTML views, PDF and ePub downloads, according to the available data) and Abstracts Views on Vision4Press platform.
Data correspond to usage on the plateform after 2015. The current usage metrics is available 48-96 hours after online publication and is updated daily on week days.
Initial download of the metrics may take a while.


