Fig. 1
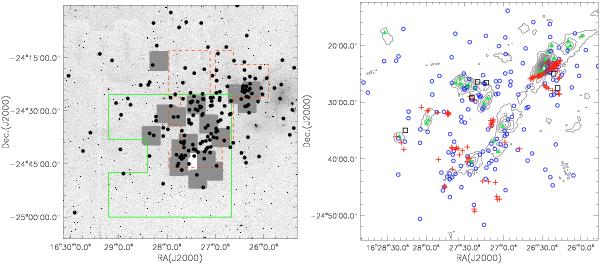
Coverage of our data. In the left panel, the underlying image is 2MASS image in Ks-band. The gray filled boxes show the coverage of SofI (2007, PID: 079.C- 0717(B)) observations. The red dashed and green solid polygons outline the coverage of the SofI 2000 (PID: 65.I- 0576(A)) and 2001 (PID: 67.C- 0284(A)) observations, respectively. The YSOs identified by Spitzer photometry (Evans et al. 2009) are marked with filled circles. In the right panel, the gray contours represent the continuum emission at 1120 μm from the COMPLETE project (Ridge et al. 2006) with the contour levels from 80 to 2000 mJy/beam and a step of 100 mJy/beam. The green filled triangles show the positions of the 1100 μm millimeter sources identified by Young et al. (2006). The newly detected MHO features are marked with black open squares and the previously known MHO features are labeled with red pluses. The YSOs identified by Spitzer photometry are marked with blue circles.
Current usage metrics show cumulative count of Article Views (full-text article views including HTML views, PDF and ePub downloads, according to the available data) and Abstracts Views on Vision4Press platform.
Data correspond to usage on the plateform after 2015. The current usage metrics is available 48-96 hours after online publication and is updated daily on week days.
Initial download of the metrics may take a while.