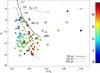
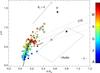
Fig. 6

Infrared colour–magnitude diagram (left) and colour–colour diagram (right) for the stellar content of our survey, with spectral type of the stars coded with colour. In the left panel the solid, dashed, and dotted lines show the ZAMS location from Siess et al. (2000) at a distance of 50, 100, and 300 pc respectively. Giant candidates, are over-plotted with a star-symbol. Pre-main sequence stars are shown with squares. We include the reddening vector for an extinction of AV = 5 mag. In the right panel, the thick black lines show the location of main sequence (solid) and giant (dashed) stars, the thin black dashed line and the thin black dotted lines show the location of classical T Tauri stars (TTS) and associated errors respectively. The black parallelogram shows the location of Herbig AeBe stars (see text for details).
Current usage metrics show cumulative count of Article Views (full-text article views including HTML views, PDF and ePub downloads, according to the available data) and Abstracts Views on Vision4Press platform.
Data correspond to usage on the plateform after 2015. The current usage metrics is available 48-96 hours after online publication and is updated daily on week days.
Initial download of the metrics may take a while.