Fig. 15
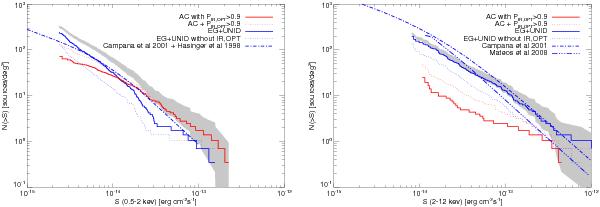
log N(>S) − log S curves in the soft band (0.5–2 keV, left panel) and the hard band (2–12 keV, right panel) for all detected X-ray sources (grey), identified active coronae with Pid > 90% (solid red lines) and unidentified plus extragalactic sources (solid blue blue). Sources either identified as active stars or with Pid higher than 90% are shown with red dotted lines, and sources either identified as extragalactic or unidentified sources with no infrared and no optical counterpart are shown with blue dotted lines. We show the expected contribution of extragalactic sources from Campana et al. (2001) plus Hasinger et al. (1998) in the soft band, and from Mateos et al. (2008) and Campana et al. (2001) in the hard band.
Current usage metrics show cumulative count of Article Views (full-text article views including HTML views, PDF and ePub downloads, according to the available data) and Abstracts Views on Vision4Press platform.
Data correspond to usage on the plateform after 2015. The current usage metrics is available 48-96 hours after online publication and is updated daily on week days.
Initial download of the metrics may take a while.