Fig. 4
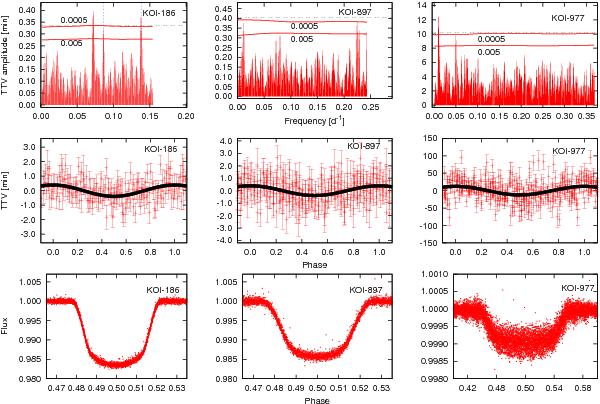
Upper panels: Fourier spectra of the transit timing variation of our best candidates. The horizontal dashed lines show the 5 s.t.d detection level, while the curves denote the frequency dependent, bootstrap false alarm probability (fap) of peak detections. Spurious peaks are denoted by vertical dashed lines in the case of KOI-186. Middle panels: folded TTV curves by the best periods. In case of KOI-977 the highest, 101.5 day peak was used. Lower panels: transit shapes of the best candidates.
Current usage metrics show cumulative count of Article Views (full-text article views including HTML views, PDF and ePub downloads, according to the available data) and Abstracts Views on Vision4Press platform.
Data correspond to usage on the plateform after 2015. The current usage metrics is available 48-96 hours after online publication and is updated daily on week days.
Initial download of the metrics may take a while.