Fig. 1
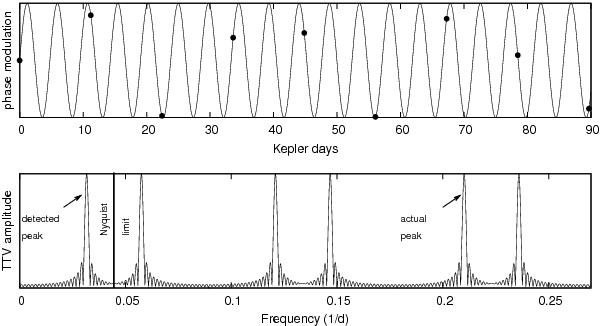
Illustration of the detection of a super-Nyquist modulation in the orbital motion with Fourier analysis. Top panel: one quarter (90-d) long detail from a 600-d long simulation. Dots represent sampling by transits. Bottom panel: Fourier series of the 600 d long data set, extended beyond the Nyquist frequency. The actual frequency and the sub-Nyquist detections are highlighted. This specific model had an orbital (sampling) and modulation period of 11.21 and 4.76 days (which were taken from the ZIP code and altitude-above-sea-level of the Budapest station of Konkoly Observatory, as uncorrelated random numbers).
Current usage metrics show cumulative count of Article Views (full-text article views including HTML views, PDF and ePub downloads, according to the available data) and Abstracts Views on Vision4Press platform.
Data correspond to usage on the plateform after 2015. The current usage metrics is available 48-96 hours after online publication and is updated daily on week days.
Initial download of the metrics may take a while.