Fig. 9
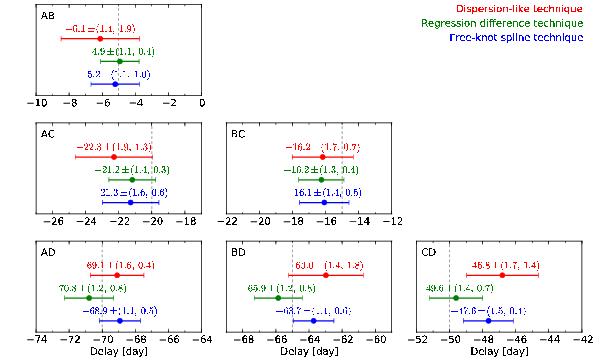
Time delay estimations and associated uncertainties obtained by each of the three curve-shifting techniques from the trial curves in Fig. 8. For each delay measurement, the random error bar, σran and the bias, σsys, are given in parentheses. The drawn error bars depict the total error, σtot, as obtained from Eq. (12). The dashed vertical lines show the true delays of the trial curves analyzed in this section.
Current usage metrics show cumulative count of Article Views (full-text article views including HTML views, PDF and ePub downloads, according to the available data) and Abstracts Views on Vision4Press platform.
Data correspond to usage on the plateform after 2015. The current usage metrics is available 48-96 hours after online publication and is updated daily on week days.
Initial download of the metrics may take a while.