Fig. 6
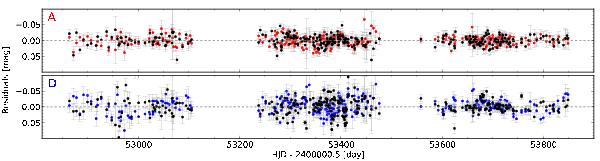
Residuals of the observed (red, blue) and the synthetic (black) light curve of images A and D of HE 0435-1223, as obtained by applying the free-knot spline method. The noise used for the synthetic curve is adjusted so that these black residuals show on average (i) the same standard deviation and (ii) the same number of “runs” as those of the observations. As described in the text, the power-law noise has been rescaled to locally match the scatter amplitude of the observed curves, as can be clearly seen in this figure.
Current usage metrics show cumulative count of Article Views (full-text article views including HTML views, PDF and ePub downloads, according to the available data) and Abstracts Views on Vision4Press platform.
Data correspond to usage on the plateform after 2015. The current usage metrics is available 48-96 hours after online publication and is updated daily on week days.
Initial download of the metrics may take a while.