Fig. 1
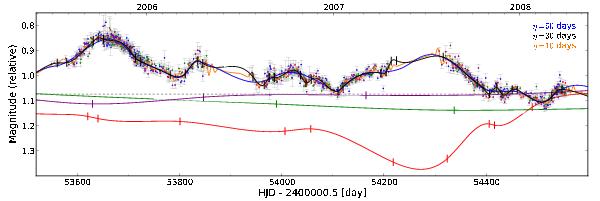
Illustration of the free-knot spline technique. The data points are shifted COSMOGRAIL light curves of the quadruply lensed quasar HE 0435-1223, published in Courbin et al. (2011). A reasonable spline representing the intrinsic variability is shown in black (initial knot step η = 30); knots are shown as vertical ticks. The red, green, and violet splines represent the relative extrinsic variability corrections, applied to the observed light curves A, C, and D (respectively), so that they match the common intrinsic spline. These extrinsic splines are plotted relative to the dashed gray line. The optimization starts with uniformly distributed knots, and the knots tend to migrate to areas in which they are required by well-constrained patterns of the data. The blue and orange curves are alternative intrinsic splines (shown without knots to avoid clutter) with inadequate knot densities of η = 50 and 10 (see text).
Current usage metrics show cumulative count of Article Views (full-text article views including HTML views, PDF and ePub downloads, according to the available data) and Abstracts Views on Vision4Press platform.
Data correspond to usage on the plateform after 2015. The current usage metrics is available 48-96 hours after online publication and is updated daily on week days.
Initial download of the metrics may take a while.