Fig. 31
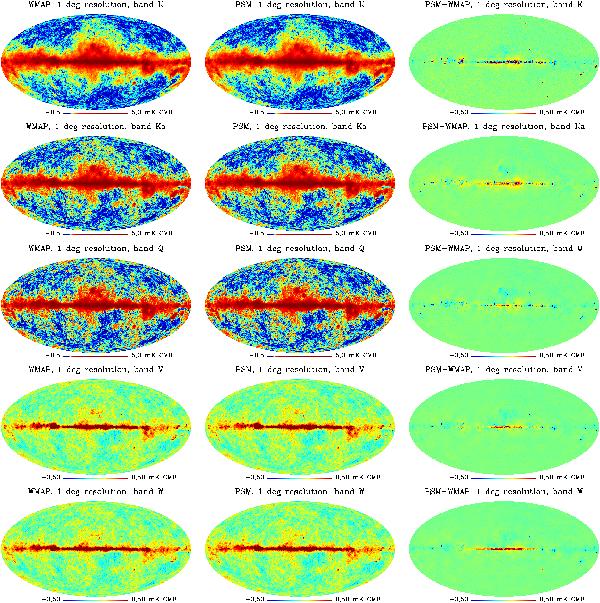
Comparison of sky emission as observed by WMAP (7-year data) and as predicted by the PSM in the same frequency bands, at a resolution of 1°. For each frequency channel, the colour scale is the same for WMAP (left column) and PSM prediction (middle column). An histogram equalised colour scale is used for the K,Ka, and Q channels, and a linear scale for the V and W channels. Maps are saturated to highlight common features away from the galactic plane. Maps of difference between PSM prediction and WMAP observation are displayed in the right column (note that the colour scale is different from that used to display the K,Ka and Q maps), highlighting discrepancies in the galactic plane specifically and at the location of a few regions of compact emission. The agreement is excellent over most of the sky away from the galactic ridge and a few compact regions.
Current usage metrics show cumulative count of Article Views (full-text article views including HTML views, PDF and ePub downloads, according to the available data) and Abstracts Views on Vision4Press platform.
Data correspond to usage on the plateform after 2015. The current usage metrics is available 48-96 hours after online publication and is updated daily on week days.
Initial download of the metrics may take a while.