Free Access
Fig. 30
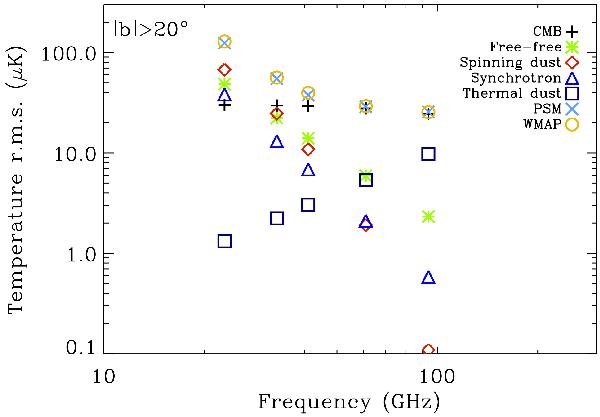
Temperature rms fluctuations at WMAP frequencies for |b| > 20° at a resolution of 10°. The symbols represent the fluctuations in the various diffuse components of the sky model, the total simulated fluctuations, and WMAP 7-year maps. The total signal is a good match to the WMAP data.
Current usage metrics show cumulative count of Article Views (full-text article views including HTML views, PDF and ePub downloads, according to the available data) and Abstracts Views on Vision4Press platform.
Data correspond to usage on the plateform after 2015. The current usage metrics is available 48-96 hours after online publication and is updated daily on week days.
Initial download of the metrics may take a while.