Fig. 26
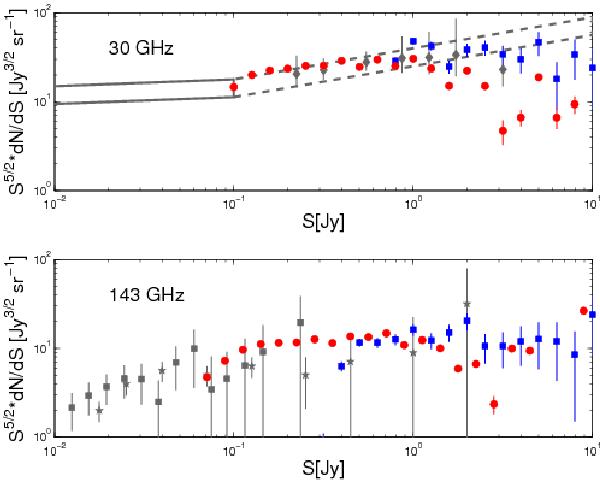
Comparison of modelled radio source counts (red points) and the Planck radio counts (blue points, Planck Collaboration 2011g). Also shown are: the counts estimated at 31 GHz from DASI (grey dashed box, Kovac et al. 2002) and PACO (grey diamonds, Bonavera et al. 2011), at 33 GHz from the VSA data (grey box, Cleary et al. 2005), and the SPT (grey squares, Vieira et al. 2010) and ACT (grey stars, Marriage et al. 2011b) counts of radio sources.
Current usage metrics show cumulative count of Article Views (full-text article views including HTML views, PDF and ePub downloads, according to the available data) and Abstracts Views on Vision4Press platform.
Data correspond to usage on the plateform after 2015. The current usage metrics is available 48-96 hours after online publication and is updated daily on week days.
Initial download of the metrics may take a while.