Fig. 25
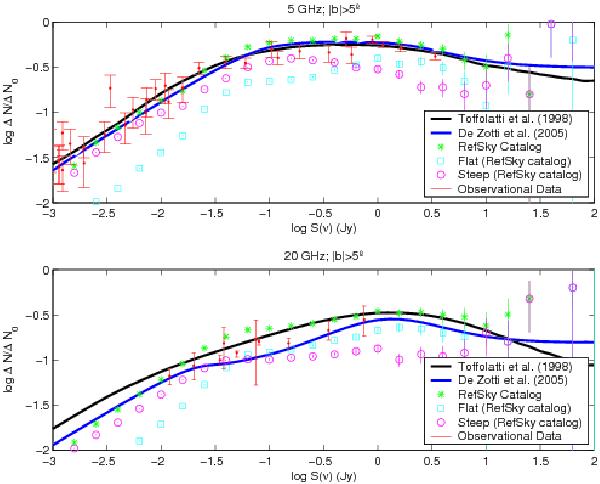
Modelled source number counts at 5 and 20 GHz for one sky realisation, normalised to ΔN0 = S(Jy)-2.5, compared with models and observational data. Data at 5 GHz are from Kellermann et al. (1986), Fomalont et al. (1991), and Haarsma et al. (2000). Data in the 20 GHz panel are from the 9C survey (Waldram et al. 2003) at 15 GHz and from the ATCA survey at 18 GHz (Ricci et al. 2004a); no correction for the difference in frequency was applied.
Current usage metrics show cumulative count of Article Views (full-text article views including HTML views, PDF and ePub downloads, according to the available data) and Abstracts Views on Vision4Press platform.
Data correspond to usage on the plateform after 2015. The current usage metrics is available 48-96 hours after online publication and is updated daily on week days.
Initial download of the metrics may take a while.