Fig. 23
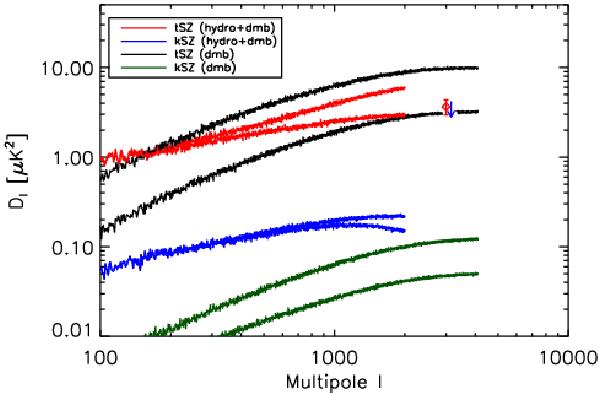
Power spectra Dℓ = ℓ(ℓ + 1)Cℓ/2π of thermal and kinetic SZ effect, as modelled by the PSM for various options. Black (resp. green) curves give the spectrum of the tSZ (resp. kSZ) maps as modelled on the basis of a population of clusters as described in 5.1.2. Upper curves are obtained using the mass function of Tinker et al. (2008) with WMAP 7-year cosmological parameters and the Y–M scaling law of Arnaud et al. (2010). Lower curves are obtained when the value of σ8 is set to 0.75 instead of 0.809, and assuming an hydrostatic bias of 15% in the Y–M scaling law, i.e., the Y parameter is 15% lower than in Arnaud et al. (2010) for a given cluster mass. Red (resp. blue) curves are tSZ (resp. kSZ) power spectra for the model described in 5.1.4, where the high redshift part is generated with the same two modelling alternatives (upper curves for σ8 = 0.809 and no hydrostatic bias, lower curves for σ8 = 0.75 and 15% hydrostatic bias). As the low-redshift part of the SZ maps uses maps at HEALPix Nside = 1024, power spectra for this case are computed only up to ℓ = 2000. The red diamond at ℓ = 3000 is the tSZ measurement of  μK2 obtained recently by SPT (Reichardt et al. 2012), improving on previous measurements from Lueker et al. (2010), Dunkley et al. (2011), and Shirokoff et al. (2011). The blue arrow is the corresponding upper limit for kSZ.
Current usage metrics show cumulative count of Article Views (full-text article views including HTML views, PDF and ePub downloads, according to the available data) and Abstracts Views on Vision4Press platform.
Data correspond to usage on the plateform after 2015. The current usage metrics is available 48-96 hours after online publication and is updated daily on week days.
Initial download of the metrics may take a while.