Fig. 22
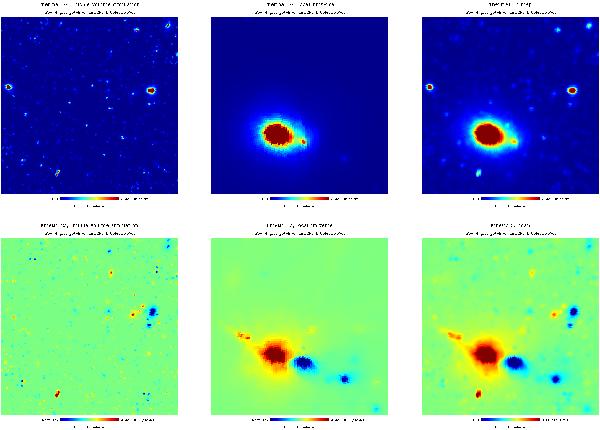
Maps of thermal and kinetic SZ effect from the Hubble volume simulation (left column), from the local universe (middle column), and total thermal and kinetic SZ effects from both simulations together, smoothed here to a sky resolution of 5 arc-min (right column). All the displayed maps are small 5° × 5° patches centred on the North Galactic Pole. The original full sky maps are at HEALPix Nside = 2048 for the Hubble volume, and at Nside = 1024 for the local hydrodynamical simulations. The contribution from the local universe comprises a large cluster at sky coordinates close to those of the Coma cluster, which dominates the total SZ emission in the maps displayed here.
Current usage metrics show cumulative count of Article Views (full-text article views including HTML views, PDF and ePub downloads, according to the available data) and Abstracts Views on Vision4Press platform.
Data correspond to usage on the plateform after 2015. The current usage metrics is available 48-96 hours after online publication and is updated daily on week days.
Initial download of the metrics may take a while.