Fig. 11
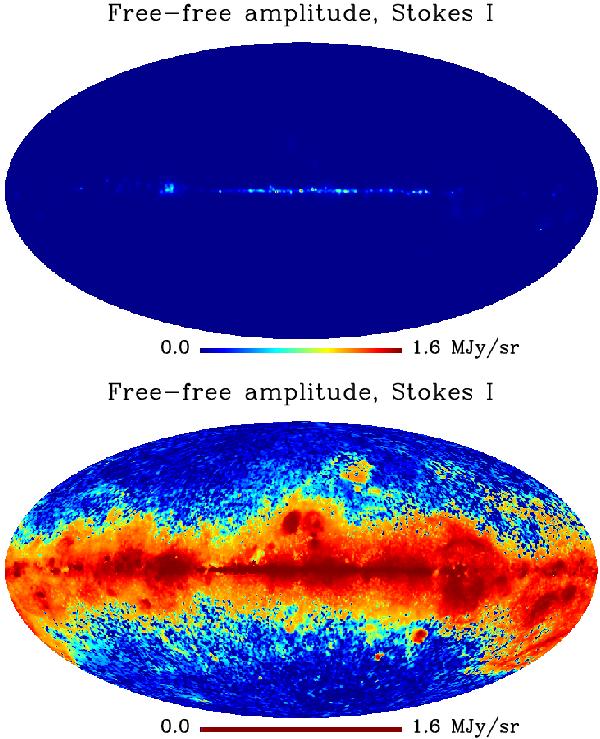
Template map at 23 GHz used to model the intensity of free-free emission in the PSM. As seen in the top panel, free-free emission is strongly concentrated in compact regions of the Galactic plane. The colour scale of the bottom panel is histogram–equalised to increase the dynamic range, and to show more extended, diffuse structures.
Current usage metrics show cumulative count of Article Views (full-text article views including HTML views, PDF and ePub downloads, according to the available data) and Abstracts Views on Vision4Press platform.
Data correspond to usage on the plateform after 2015. The current usage metrics is available 48-96 hours after online publication and is updated daily on week days.
Initial download of the metrics may take a while.