Fig. A.1
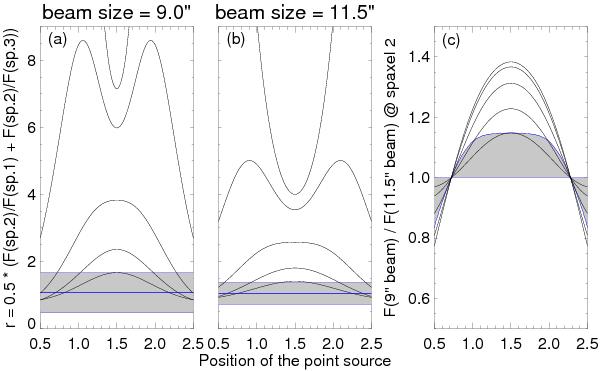
Black curves show the simulated r, defined as Eq. (A.1), as a function of the position of the point source for the beam size of a) 9′′ and b) 11.5′′. The relative contribution of the extended source compared to the height of the point source at 63 μm is 0.0, 0.02, 0.1, 0.3, and 0.7 from upper to lower curves. Shaded areas represent the observed values with errors of ±3σ (blue lines in Fig. A.2). c) The flux ratio of 9′′ beam and 11.5′′ beam at spaxel 2 as a function of the position of the point source with the same model. Shaded areas show ranges when r in a) or b) matches the observed value.
Current usage metrics show cumulative count of Article Views (full-text article views including HTML views, PDF and ePub downloads, according to the available data) and Abstracts Views on Vision4Press platform.
Data correspond to usage on the plateform after 2015. The current usage metrics is available 48-96 hours after online publication and is updated daily on week days.
Initial download of the metrics may take a while.