Fig. 4
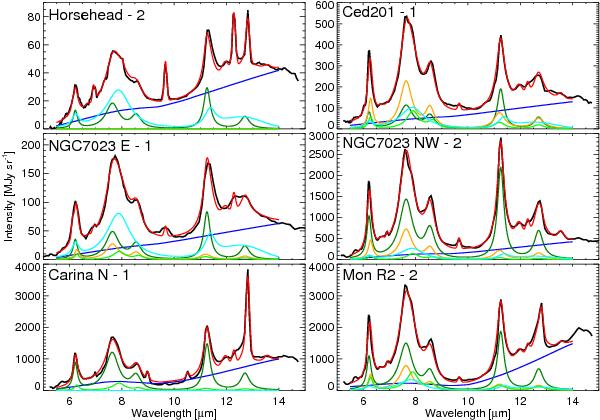
Fit of the MIR spectra using the PAHTAT procedure (Pilleri et al. 2012b) at the same positions as in Fig. 2, assuming the mixed extinction model and RV = 3.1. The black line shows the observed spectrum, the red line is the fitted spectrum, the blue line represents the continuum, green, orange, light-green and light-blue show the PAH0, PAH+, PAHx, and eVSG components.
Current usage metrics show cumulative count of Article Views (full-text article views including HTML views, PDF and ePub downloads, according to the available data) and Abstracts Views on Vision4Press platform.
Data correspond to usage on the plateform after 2015. The current usage metrics is available 48-96 hours after online publication and is updated daily on week days.
Initial download of the metrics may take a while.