Fig. 3
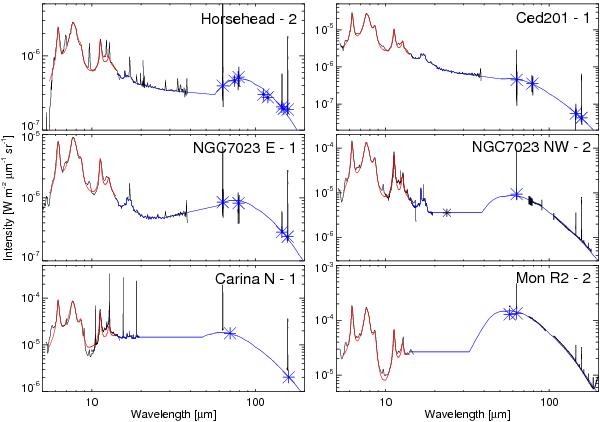
Continuum fit at the same positions as in Fig. 2. The black lines are the observed spectra, while the red and blue lines are the models used to estimate the TIR. The blue asterisks are the data points that are used for fitting the FIR thermal dust emission (see text). The blue curve in the FIR is the fit with the thermal dust model, that in the MIR indicates either the direct integration, the linear fit, or the assumed constant value. The red curve below 14 μm shows the fit described in Sect. 3.2. The black asterisk in NGC 7023 NW is the MIPS 24 μm flux.
Current usage metrics show cumulative count of Article Views (full-text article views including HTML views, PDF and ePub downloads, according to the available data) and Abstracts Views on Vision4Press platform.
Data correspond to usage on the plateform after 2015. The current usage metrics is available 48-96 hours after online publication and is updated daily on week days.
Initial download of the metrics may take a while.