Fig. 8
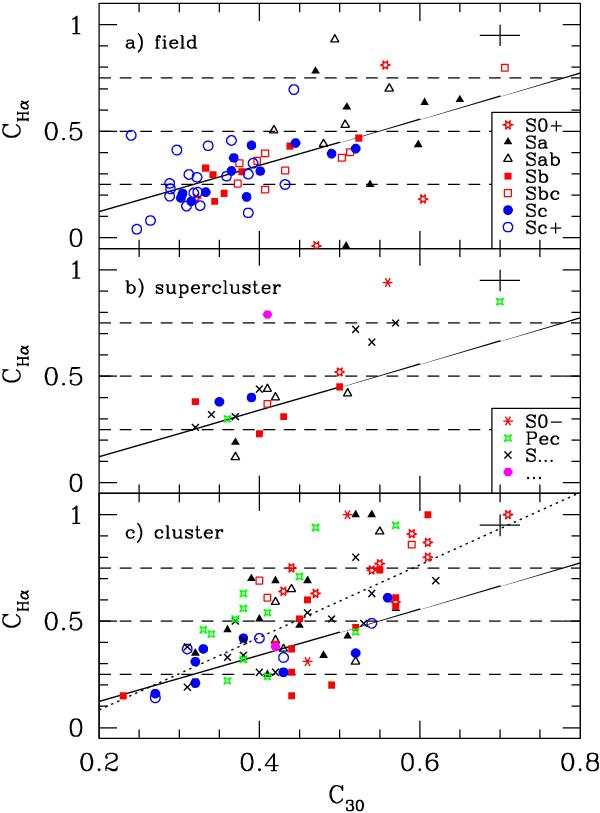
Hα concentration index, CHα, plotted against R-band concentration index, C30, for the full field comparison sample and the cluster and supercluster ELG objects. Here the solid line is the best fit to the full field data and has equation CHα = 1.085C30 − 0.094. The dotted line in the lower panel shows an alternative best fit line, with equation CHα = 1.702c30 − 0.257, calculated from only the cluster ELG data. This shows that the relationship between C30 and CHα is noticeably steeper for the cluster sample than it is for the field. Typical error bars are shown in the upper-right corner of each frame.
Current usage metrics show cumulative count of Article Views (full-text article views including HTML views, PDF and ePub downloads, according to the available data) and Abstracts Views on Vision4Press platform.
Data correspond to usage on the plateform after 2015. The current usage metrics is available 48-96 hours after online publication and is updated daily on week days.
Initial download of the metrics may take a while.