Free Access
Fig. 6
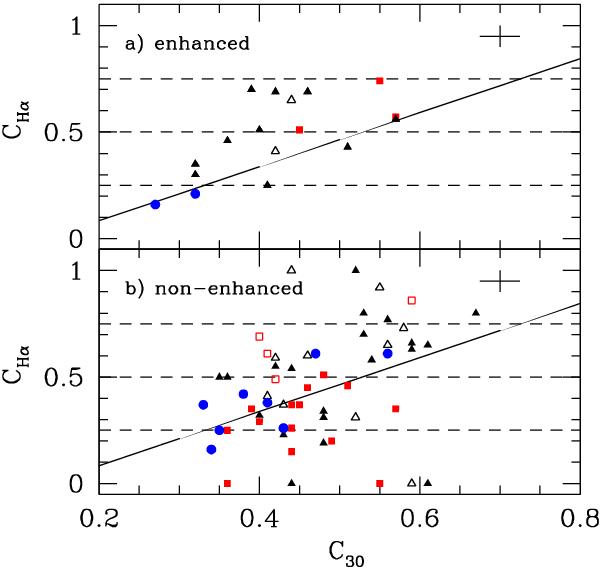
CHα vs. C30 for cluster Sa–Sc data, split into enhanced and non-enhanced objects. The solid and dashed lines and point types are the same as used in Fig. 5. Typical error bars are shown in the upper-right corner of both frames.
Current usage metrics show cumulative count of Article Views (full-text article views including HTML views, PDF and ePub downloads, according to the available data) and Abstracts Views on Vision4Press platform.
Data correspond to usage on the plateform after 2015. The current usage metrics is available 48-96 hours after online publication and is updated daily on week days.
Initial download of the metrics may take a while.