Fig. 5
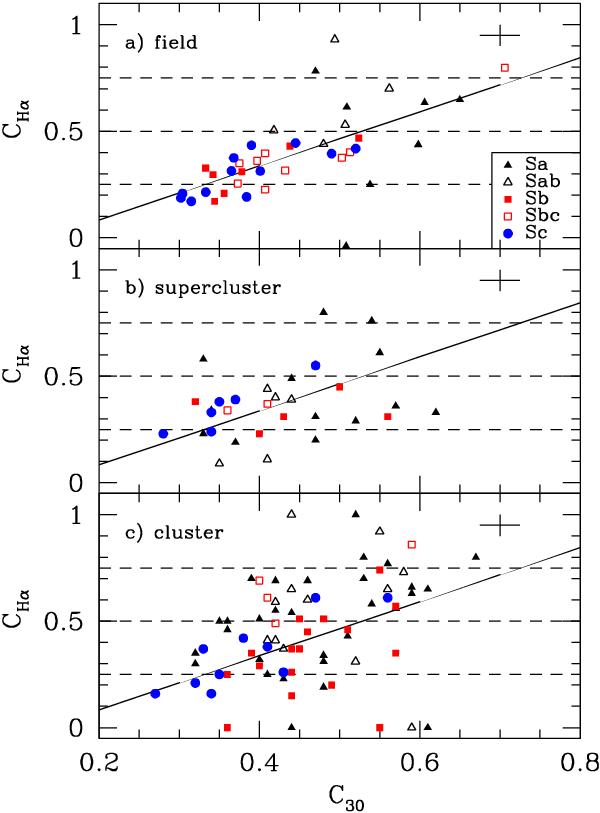
Hα concentration index, CHα, plotted against R-band central light concentration, C30, for field, supercluster and cluster Sa–Sc galaxies. The dashed lines show the values of CHα at which an object has three-quarters, half and one-quarter (top to bottom) of its Hα emission within 0.3r24. The solid line has equation CHα = 1.269C30 − 0.170 and is the best fit line to the field data. Cluster Sa–Sc spirals tend to have more concentrated Hα emission, and hence star formation, relative to R-band concentration, than their field counterparts. The cluster galaxies lying at CHα = 0 are those for which no Hα was detected. Typical error bars are shown in the upper-right corner of each frame.
Current usage metrics show cumulative count of Article Views (full-text article views including HTML views, PDF and ePub downloads, according to the available data) and Abstracts Views on Vision4Press platform.
Data correspond to usage on the plateform after 2015. The current usage metrics is available 48-96 hours after online publication and is updated daily on week days.
Initial download of the metrics may take a while.