Free Access
Fig. 3
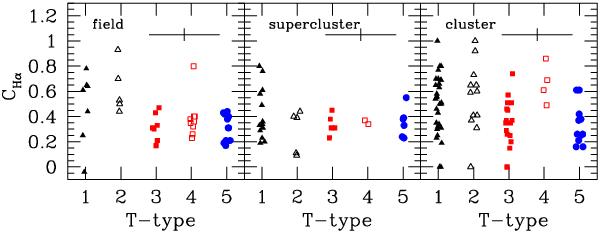
Distribution of CHα with T-type. Five cluster galaxies with no detected Hα emission have been excluded from the plot. Typical error bars are shown in the upper-right corner of each frame.
Current usage metrics show cumulative count of Article Views (full-text article views including HTML views, PDF and ePub downloads, according to the available data) and Abstracts Views on Vision4Press platform.
Data correspond to usage on the plateform after 2015. The current usage metrics is available 48-96 hours after online publication and is updated daily on week days.
Initial download of the metrics may take a while.