Free Access
Fig. 13
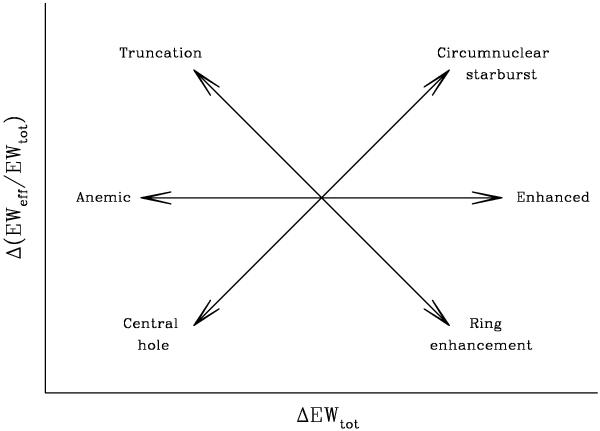
Diagram showing a number of processes that occur in cluster galaxies and the effect each would have on the total Hα EW and on its concentration relative to the continuum emission.
Current usage metrics show cumulative count of Article Views (full-text article views including HTML views, PDF and ePub downloads, according to the available data) and Abstracts Views on Vision4Press platform.
Data correspond to usage on the plateform after 2015. The current usage metrics is available 48-96 hours after online publication and is updated daily on week days.
Initial download of the metrics may take a while.