Fig. 7
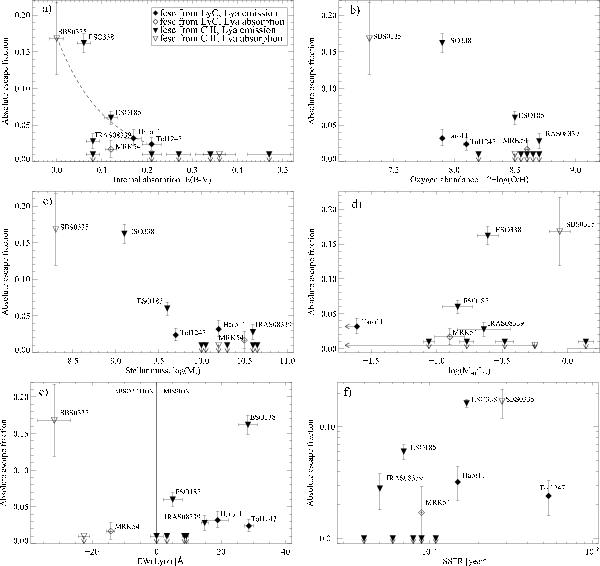
Tentative plots of the escape fraction against various properties of the galaxies. The rhombs symbolize galaxies where fesc was measured directly on the Lyman continuum, the triangles galaxies where fesc was estimated using the residual flux in the C ii λ1036Å line. Filled symbols represent galaxies with Lyα in emission, open symbols galaxies with Lyα in absorption. The fesc errors are plotted for 1σ. An abridgment marking the positions of the most interesting galaxies are also shown. In panel a) fesc against the intrinsic absorption. The hatched line shows the position of Tol 1247-232 for the range of E(B − V)i = 0 − 0.21 as described in the text, b) fesc against the oxygen abundance, c) fesc against stellar mass [ℳ⊙], d) fesc against H i mass related to the number of ionizing photons via LB (solar units), e) fesc against Lyα equivalent width, and f) fesc against the specific star formation rate (SFR/ℳ⋆).
Current usage metrics show cumulative count of Article Views (full-text article views including HTML views, PDF and ePub downloads, according to the available data) and Abstracts Views on Vision4Press platform.
Data correspond to usage on the plateform after 2015. The current usage metrics is available 48-96 hours after online publication and is updated daily on week days.
Initial download of the metrics may take a while.