Fig. 3
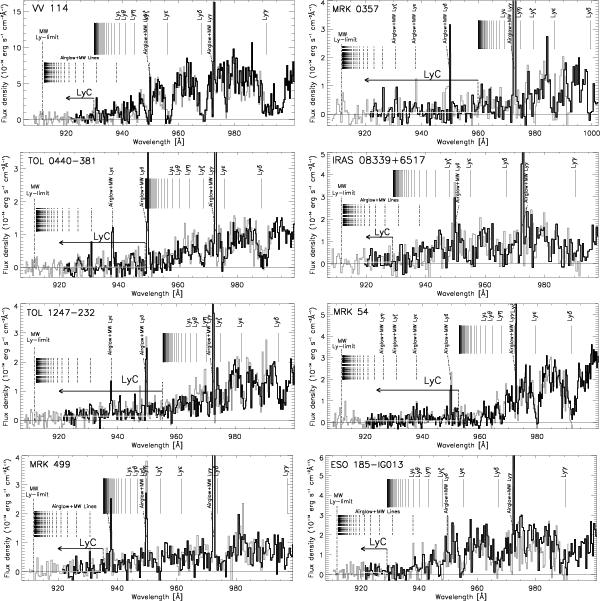
The night-only spectra of the eight galaxies for which assessment directly on the Lyman continuum is possible. The SiC 2A data is plotted in black, the SiC 1B data in gray. Marked are also the intrinsic Ly-lines, as well as Milky Way absorption lines with geocoronal airglow emission superposed. The horizontal white line indicates the level of the measured mean of the Lyman continuum.
Current usage metrics show cumulative count of Article Views (full-text article views including HTML views, PDF and ePub downloads, according to the available data) and Abstracts Views on Vision4Press platform.
Data correspond to usage on the plateform after 2015. The current usage metrics is available 48-96 hours after online publication and is updated daily on week days.
Initial download of the metrics may take a while.