Fig. 2
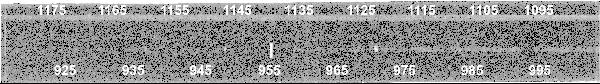
The 2A detector segment of Tol 1247-232. The upper spectrum is the LiF channel, and the lower spectrum is the SiC channel. The Lyman limit in the SiC channel is marked with a white vertical line. Airglow lines are visible as bright point-like structures. The wavelengths are given in Å. The image is shown in original size with 16 384 × 1024 pixels and on logarithmic scale.
Current usage metrics show cumulative count of Article Views (full-text article views including HTML views, PDF and ePub downloads, according to the available data) and Abstracts Views on Vision4Press platform.
Data correspond to usage on the plateform after 2015. The current usage metrics is available 48-96 hours after online publication and is updated daily on week days.
Initial download of the metrics may take a while.