Fig. 2
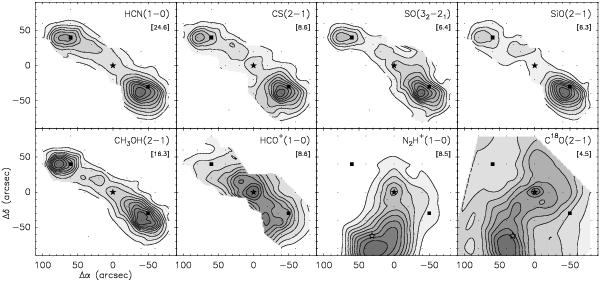
Emission from dense-gas tracers in the vicinity of HH 114 MMS. The maps represent emission integrated over the complete velocity range of detection. Contours are at 10, 20, ... 90% of the map maximum, whose value in K km s-1 is given within brackets under the name of the transition. Central positions, dots, and solid star as in Fig. 1. The open star in the last two panels represents IRAS 05155+0707.
Current usage metrics show cumulative count of Article Views (full-text article views including HTML views, PDF and ePub downloads, according to the available data) and Abstracts Views on Vision4Press platform.
Data correspond to usage on the plateform after 2015. The current usage metrics is available 48-96 hours after online publication and is updated daily on week days.
Initial download of the metrics may take a while.