Fig. 2
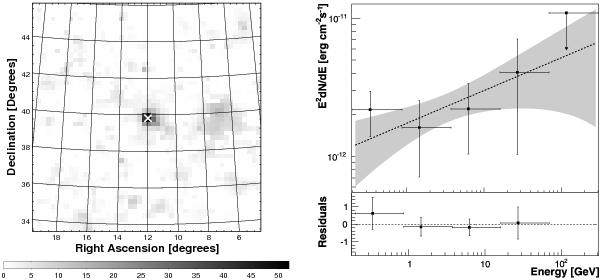
Left panel: un-binned likelihood test statistic map corresponding to subinterval G of the Fermi-LAT dataset. The white cross marks the nominal radio position of 5C 3.178. Right panel: HE γ-ray spectral energy distribution between 0.2 and 300 GeV corresponding to subinterval G of the Fermi-LAT dataset. The dotted line indicates the best-fitting power-law model, and the grey region indicates the 1σ fit uncertainties. Residuals of the observed data points with respect to the best fitting power law spectral model are also presented.
Current usage metrics show cumulative count of Article Views (full-text article views including HTML views, PDF and ePub downloads, according to the available data) and Abstracts Views on Vision4Press platform.
Data correspond to usage on the plateform after 2015. The current usage metrics is available 48-96 hours after online publication and is updated daily on week days.
Initial download of the metrics may take a while.