Fig. 1
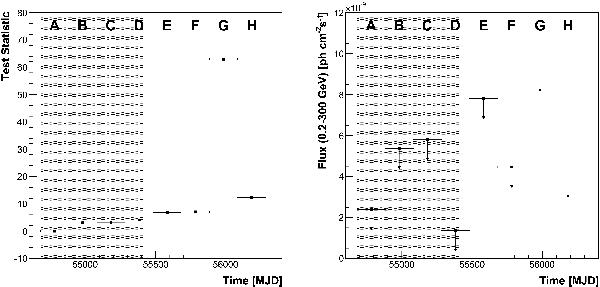
Left panel: values of TS corresponding to intervals A–H. Right panel: 95% confidence upper limits on the 0.2–300 GeV γ-ray flux are presented for intervals during the intervals in which the source was not detected. The shaded areas in both plots indicate the temporal extent of the Fermi-LAT dataset used to compile the 2FGL catalogue (Nolan et al. 2012).
Current usage metrics show cumulative count of Article Views (full-text article views including HTML views, PDF and ePub downloads, according to the available data) and Abstracts Views on Vision4Press platform.
Data correspond to usage on the plateform after 2015. The current usage metrics is available 48-96 hours after online publication and is updated daily on week days.
Initial download of the metrics may take a while.