Fig. A.1
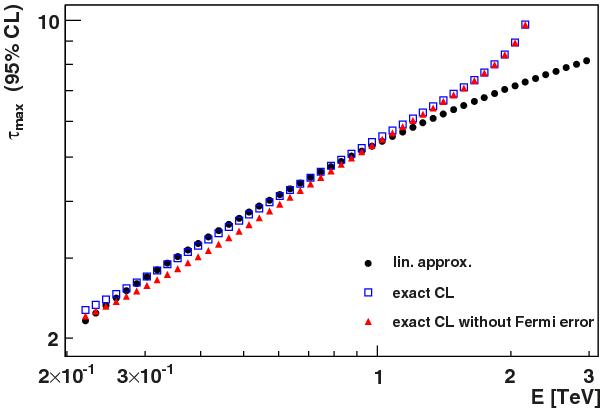
Distribution of τmax vs. energy for three different treatments of the statistical errors (systematic errors are neglected). Red triangles: only statistical errors in the H.E.S.S. spectrum are taken into account; black circles: statistical errors in the Fermi-LAT and H.E.S.S. fluxes are included in the linear approximation; blue open squares: statistical errors from Fermi-LAT and H.E.S.S. are included using the exact analytic solution derived here.
Current usage metrics show cumulative count of Article Views (full-text article views including HTML views, PDF and ePub downloads, according to the available data) and Abstracts Views on Vision4Press platform.
Data correspond to usage on the plateform after 2015. The current usage metrics is available 48-96 hours after online publication and is updated daily on week days.
Initial download of the metrics may take a while.