Fig. 8
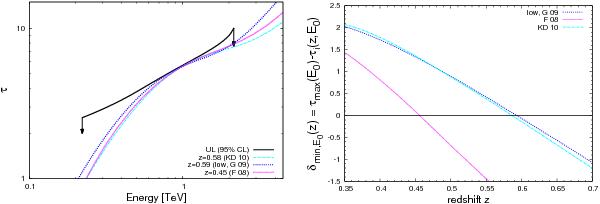
Left panel: upper limit at 95% CL on the optical depth as a function of energy (solid line) as derived from Eq. (1). The optical depth distribution derived with different EBL models at specific redshifts is shown for comparison (dash-dotted line: Kneiske & Dole 2010; dashed line: Gilmore et al. 2009, “low” model; dotted line: Franceschini et al. 2008). Right panel: the minimum difference δmin,E0 between the maximum optical depth derived here and the optical depths predicted by the same EBL models is shown as a function of the redshift. E0 is the energy for which, at a given redshift, the difference between the derived and predicted optical depths is minimized. The upper limit on the redshift, for each EBL model under consideration, corresponds to δmin,E0 = 0.


Current usage metrics show cumulative count of Article Views (full-text article views including HTML views, PDF and ePub downloads, according to the available data) and Abstracts Views on Vision4Press platform.
Data correspond to usage on the plateform after 2015. The current usage metrics is available 48-96 hours after online publication and is updated daily on week days.
Initial download of the metrics may take a while.