Fig. 7
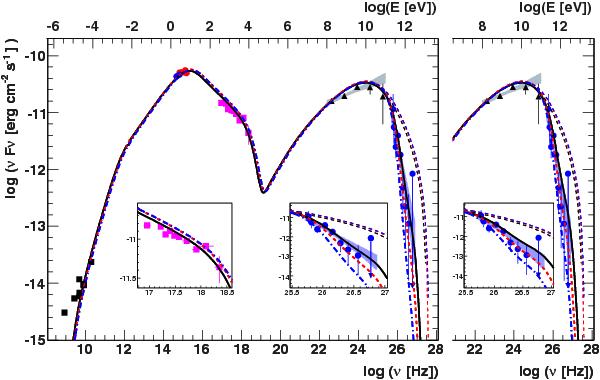
Spectral energy distribution of PKS 0447−439 showing archival radio data from NED and SIMBAD/VizieR (black squares; details are given in the text), optical and UV data from ATOM (blue filled circles) and Swift UVOT (red filled circles), X-ray data from Swift XRT and RXTE PCA (magenta squares), γ-ray data from Fermi-LAT (black triangles and grey bow-tie) and VHE γ-ray data from H.E.S.S. (blue filled circles and light blue bow-tie). The models shown here correspond to a redshift of 0.2 (black solid line; deabsorbed spectrum shown by thin black dashed line), 0.3 (red dashed line; deabsorbed spectrum shown by thin red dashed line) and 0.4 (blue dash-dotted line; deabsorbed spectrum shown by thin blue dashed line). For the graph on the left panel, the EBL model uses the description by Franceschini et al. (2008). On the right panel, only the high-energy part of the SED is shown, with an EBL model following the description by Kneiske & Dole (2010), which presents a very low EBL level. The inlays show a zoom on the X-ray range and VHE range of the SED.
Current usage metrics show cumulative count of Article Views (full-text article views including HTML views, PDF and ePub downloads, according to the available data) and Abstracts Views on Vision4Press platform.
Data correspond to usage on the plateform after 2015. The current usage metrics is available 48-96 hours after online publication and is updated daily on week days.
Initial download of the metrics may take a while.