Fig. 6
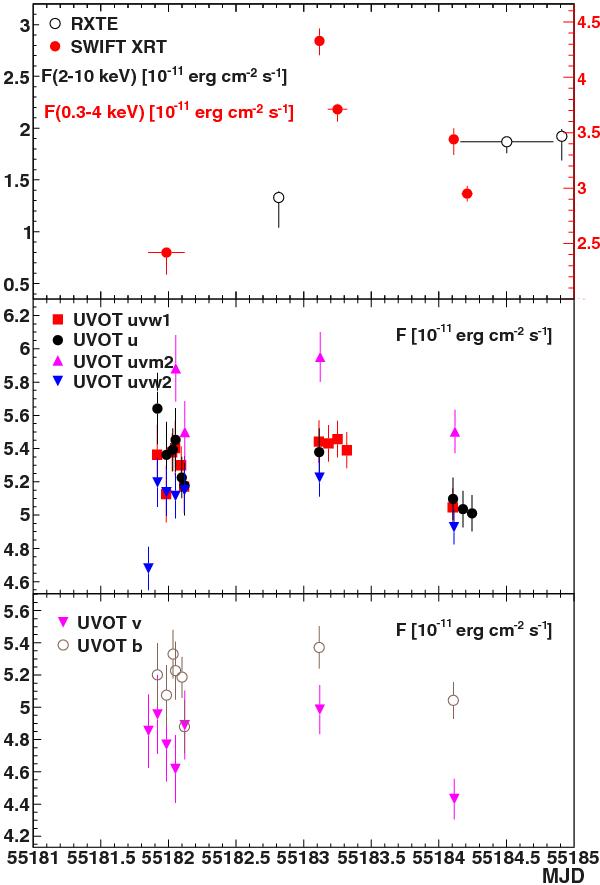
Zoom on the RXTE/PCA, XRT and UVOT light curves around the flare observed with XRT. Horizontal error bars indicate the duration of the time intervals over which fluxes were averaged. A flux decrease can be seen in the UVOT UV data that accompanies the decline in the X-ray flux after the flare.
Current usage metrics show cumulative count of Article Views (full-text article views including HTML views, PDF and ePub downloads, according to the available data) and Abstracts Views on Vision4Press platform.
Data correspond to usage on the plateform after 2015. The current usage metrics is available 48-96 hours after online publication and is updated daily on week days.
Initial download of the metrics may take a while.