Fig. 5
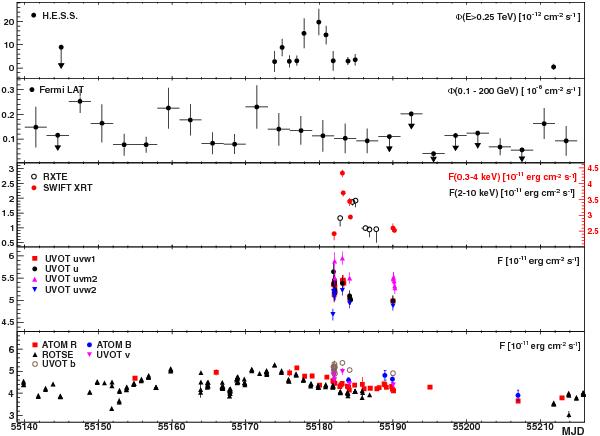
Multi-wavelength light curves for the time period from November 2009 to January 2010. The first panel shows the integrated flux above 250 GeV seen with H.E.S.S., while the Fermi-LAT flux between 0.1 and 200 GeV is presented in the second panel. Horizontal error bars indicate the duration of the time intervals over which fluxes were averaged. Upper limits are given at the 95% confidence level (CL) in the H.E.S.S. and Fermi data. The third panel shows the X-ray fluxes between 2 and 10 keV from RXTE (open circles, y-axis on the left) and between 0.3 and 4 keV from Swift XRT (filled circles, y-axis on the right). UV data taken with Swift UVOT with the u,UVW1,UVW2 and UVM2 filters are shown in the fourth panel. The last panel includes optical data from the b and v filters from UVOT, in the B and R bands from ATOM and in the R band from ROTSE. For the UV and optical data from UVOT, flux densities have been multiplied by the central wavelengths of the corresponding filters.
Current usage metrics show cumulative count of Article Views (full-text article views including HTML views, PDF and ePub downloads, according to the available data) and Abstracts Views on Vision4Press platform.
Data correspond to usage on the plateform after 2015. The current usage metrics is available 48-96 hours after online publication and is updated daily on week days.
Initial download of the metrics may take a while.