Fig. 4
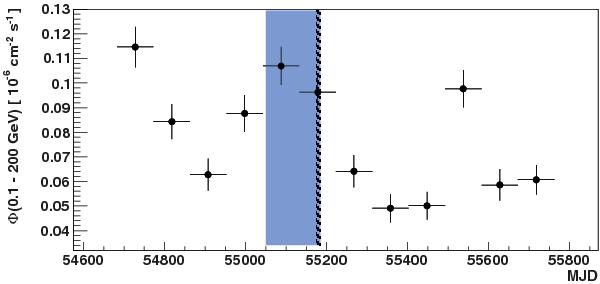
Fermi-LAT long-term light curve of PKS 0447−439 showing the photon flux integrated between 0.1 GeV and 200 GeV in intervals of 90 days. The horizontal error bars indicate the duration of the intervals. The period chosen for the extraction of the Fermi-LAT spectrum is indicated by the large blue band. The thin, striped band corresponds to the H.E.S.S. observational period in December 2009.
Current usage metrics show cumulative count of Article Views (full-text article views including HTML views, PDF and ePub downloads, according to the available data) and Abstracts Views on Vision4Press platform.
Data correspond to usage on the plateform after 2015. The current usage metrics is available 48-96 hours after online publication and is updated daily on week days.
Initial download of the metrics may take a while.