Fig. 3
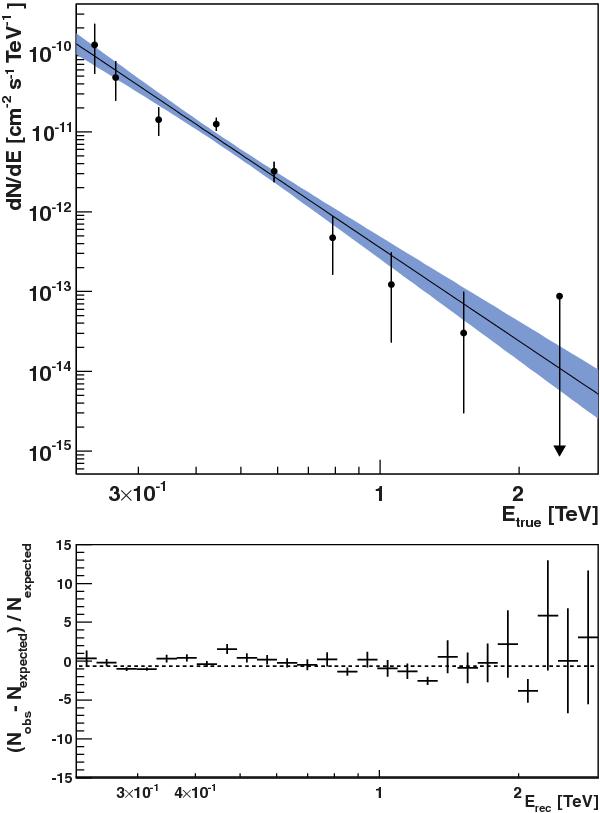
H.E.S.S. spectrum of the source extracted from the complete data set. The differential flux points (with an excess significance of 1σ) and the 68% confidence band for the best fit are shown in the upper panel, as a function of true energy. The arrow represents an upper limit at the 99% confidence level. The residuals of the maximum likelihood fit are given in the lower panel as a function of the reconstructed energy, together with a fit of a constant (dashed line).
Current usage metrics show cumulative count of Article Views (full-text article views including HTML views, PDF and ePub downloads, according to the available data) and Abstracts Views on Vision4Press platform.
Data correspond to usage on the plateform after 2015. The current usage metrics is available 48-96 hours after online publication and is updated daily on week days.
Initial download of the metrics may take a while.