Fig. 1
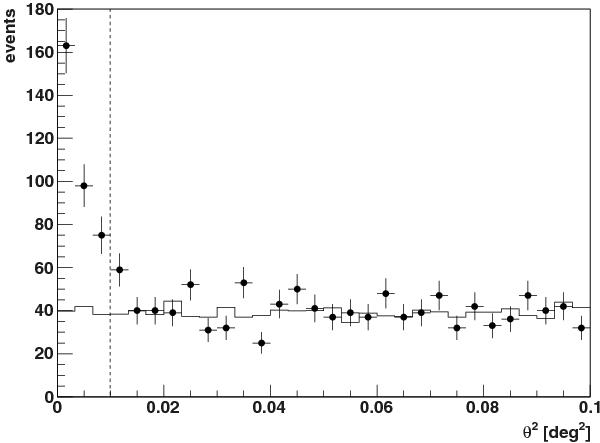
Distribution of the squared angular distance of γ-ray events from the nominal source position. The points represent the distribution for on-source events. The normalised off-source event distribution is described by the solid histogram. The vertical dashed line indicates the on-source integration region of 0.01 square degrees used in the analysis.
Current usage metrics show cumulative count of Article Views (full-text article views including HTML views, PDF and ePub downloads, according to the available data) and Abstracts Views on Vision4Press platform.
Data correspond to usage on the plateform after 2015. The current usage metrics is available 48-96 hours after online publication and is updated daily on week days.
Initial download of the metrics may take a while.