Fig. 2
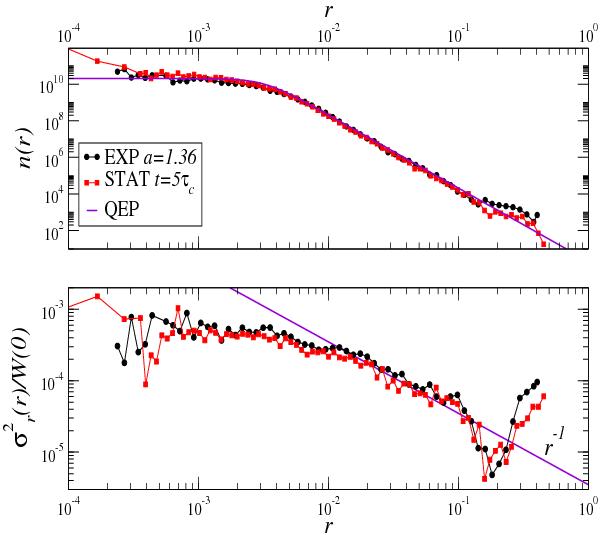
Comparison of the density (upper panel) and velocity (bottom panel) profiles of the same system evolved in an expanding background (EXP at a = 1.36 – black circles) and in a static background with open boundary conditions (STAT at t = 5τc – red squares). The best fit with Eq. (3) (QEP) and a line with slope − 1 are shown as references (see Eq. (4)).
Current usage metrics show cumulative count of Article Views (full-text article views including HTML views, PDF and ePub downloads, according to the available data) and Abstracts Views on Vision4Press platform.
Data correspond to usage on the plateform after 2015. The current usage metrics is available 48-96 hours after online publication and is updated daily on week days.
Initial download of the metrics may take a while.