Fig. 1
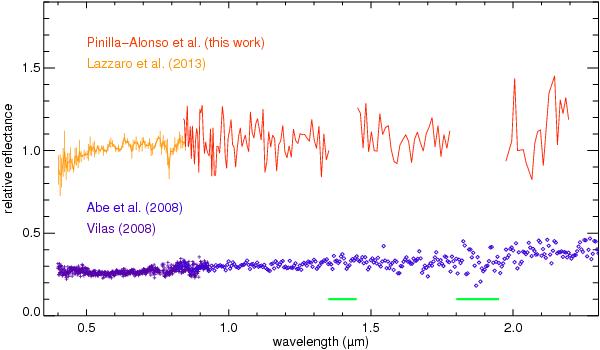
Spectrum presented in this work merged with the averaged visible spectrum from Lazzaro et al. (2013) and compared with the composite spectrum from Vilas (2008) and Abe et al. (2008). They are normalized at 0.55 μm and the one merged using Vilas (2008) and Abe et al. (2008) has been shifted for clarity. The green horizontal bars are the wavelengths dominated by telluric absorptions.
Current usage metrics show cumulative count of Article Views (full-text article views including HTML views, PDF and ePub downloads, according to the available data) and Abstracts Views on Vision4Press platform.
Data correspond to usage on the plateform after 2015. The current usage metrics is available 48-96 hours after online publication and is updated daily on week days.
Initial download of the metrics may take a while.