Fig. 2
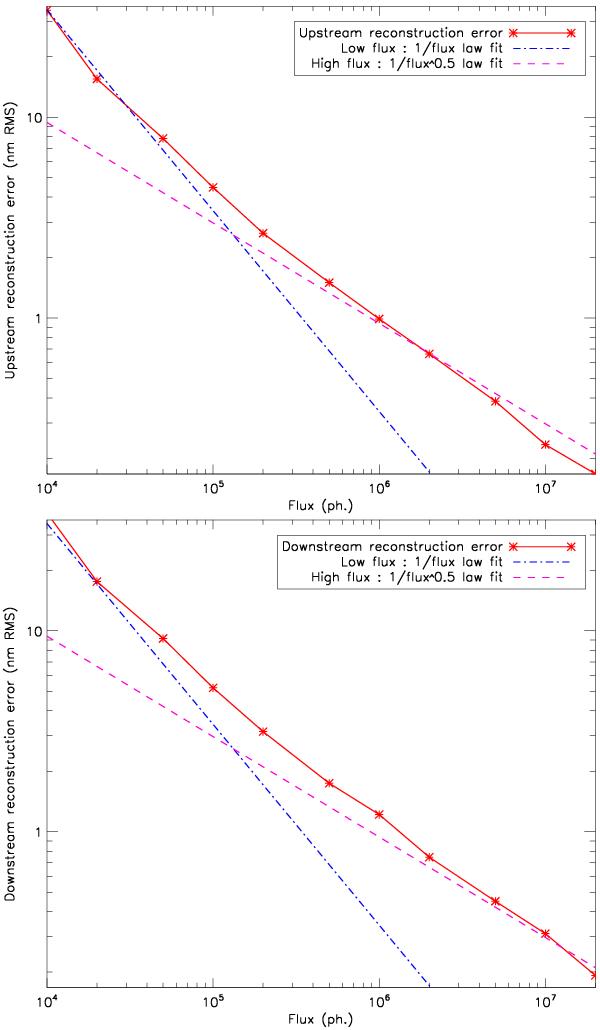
Aberrations upstream (φu (WFE = 80 nm),
top) and downstream (φd
(WFE = 20 nm), bottom) of the coronagraph: reconstruction error
(solid red line) as a function of the incoming flux α. For
comparison,  (cyan dashed line) and
  (magenta dashed line) theoretical behaviours are plotted for detector noise only and
photon noise only (respectively).
(magenta dashed line) theoretical behaviours are plotted for detector noise only and
photon noise only (respectively).
Current usage metrics show cumulative count of Article Views (full-text article views including HTML views, PDF and ePub downloads, according to the available data) and Abstracts Views on Vision4Press platform.
Data correspond to usage on the plateform after 2015. The current usage metrics is available 48-96 hours after online publication and is updated daily on week days.
Initial download of the metrics may take a while.