Fig. 11
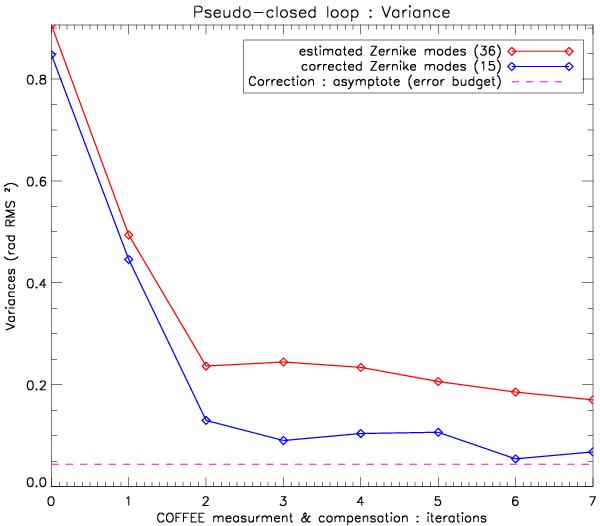
PCL on the bench BOA (gPCL = 0.5): variance of the residual static aberrations upstream of the coronagraph for the 36 COFFEE estimated Zernike modes (solid red line) and the 15 corrected modes (solid blue line). The magenta dashed line represents the ultimate performance one can reach according to the error budget detailed in 4.3.
Current usage metrics show cumulative count of Article Views (full-text article views including HTML views, PDF and ePub downloads, according to the available data) and Abstracts Views on Vision4Press platform.
Data correspond to usage on the plateform after 2015. The current usage metrics is available 48-96 hours after online publication and is updated daily on week days.
Initial download of the metrics may take a while.