Fig. 10
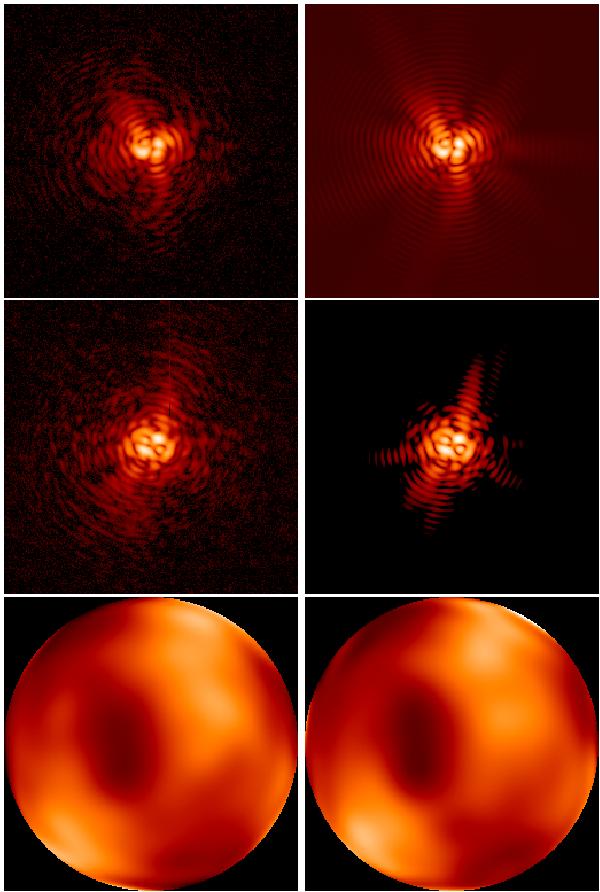
COFFEE: NCPA estimation of an introduced phase
φcal on BOA. Top: for
an aberration + φcal, recorded
coronagraphic image from the bench (left) and computed image
using the reconstructed aberration  (right) (log. scale, same range for both images).
Middle: same images for an aberration
− φcal introduced and a reconstructed
aberration
(right) (log. scale, same range for both images).
Middle: same images for an aberration
− φcal introduced and a reconstructed
aberration  (log. scale, same range for both images). Bottom: calibrated
introduced aberration (left) and COFFEE estimated aberration
(right).
(log. scale, same range for both images). Bottom: calibrated
introduced aberration (left) and COFFEE estimated aberration
(right).
Current usage metrics show cumulative count of Article Views (full-text article views including HTML views, PDF and ePub downloads, according to the available data) and Abstracts Views on Vision4Press platform.
Data correspond to usage on the plateform after 2015. The current usage metrics is available 48-96 hours after online publication and is updated daily on week days.
Initial download of the metrics may take a while.