Free Access
Fig. 6
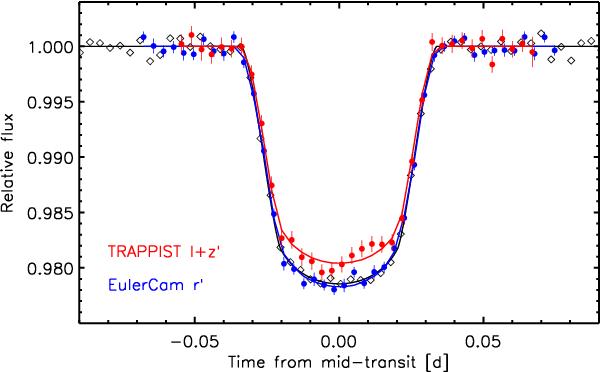
Simultaneous transit observation performed with TRAPPIST (red) and EulerCam (blue). For clarity, the data are binned into 5-min bins, and the models of the individual transits are shown as solid lines. The binned data from the combination of all I + z′ lightcurves (same as in Fig. 8) are shown in black for comparison.
Current usage metrics show cumulative count of Article Views (full-text article views including HTML views, PDF and ePub downloads, according to the available data) and Abstracts Views on Vision4Press platform.
Data correspond to usage on the plateform after 2015. The current usage metrics is available 48-96 hours after online publication and is updated daily on week days.
Initial download of the metrics may take a while.