Fig. 7
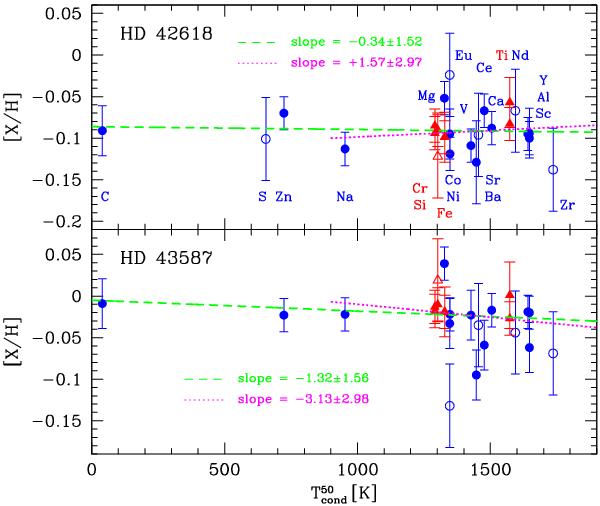
Abundances as a function of the condensation temperature. Same symbols as in Fig.
4. The fits weighted by the inverse variance,
either taking into account all the elements or only those with
 00 K, are shown as dashed
and dotted lines, respectively. The slopes (in units of 10-5 dex
K-1) are indicated.
00 K, are shown as dashed
and dotted lines, respectively. The slopes (in units of 10-5 dex
K-1) are indicated.
Current usage metrics show cumulative count of Article Views (full-text article views including HTML views, PDF and ePub downloads, according to the available data) and Abstracts Views on Vision4Press platform.
Data correspond to usage on the plateform after 2015. The current usage metrics is available 48-96 hours after online publication and is updated daily on week days.
Initial download of the metrics may take a while.