Fig. 8
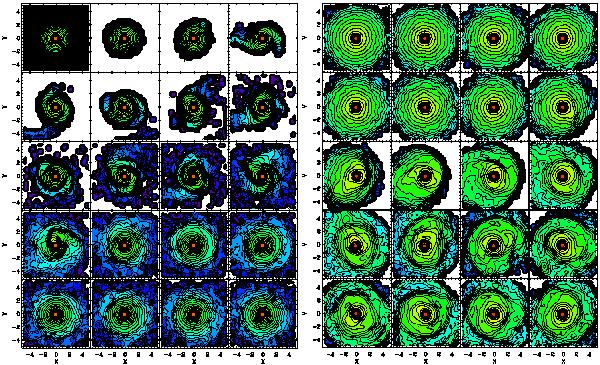
Time evolution of the luminous surface density of the primary disk material in a direct model with a large pericentre distance and mass ratio 18:1 (model M18PlDb, left panels) and in a retrograde model with a short pericentre and lower mass ratio (model M9PsRb, right panels), both assuming an initial S0b galaxy. Face-on views centered on the initial primary galaxy are plotted. Snapshots corresponding to times from 20 to 260 and from 20 to 100 are shown from top-to-bottom and left-to-right of each figure, using a time step equal to 12 and to 4 in each case (in simulation units). Scaling the primary S0b galaxy in both models to the MW (see Sect. 4), the total time period represented in each figure corresponds to ~4.5 Gyr and ~1.6 Gyr, respectively. A rainbow colour palette is used to represent different surface density levels in a logarithmic scale, with redder colours indicating higher values. Spatial scales in both axes are provided in simulation units.
Current usage metrics show cumulative count of Article Views (full-text article views including HTML views, PDF and ePub downloads, according to the available data) and Abstracts Views on Vision4Press platform.
Data correspond to usage on the plateform after 2015. The current usage metrics is available 48-96 hours after online publication and is updated daily on week days.
Initial download of the metrics may take a while.