Fig. 5
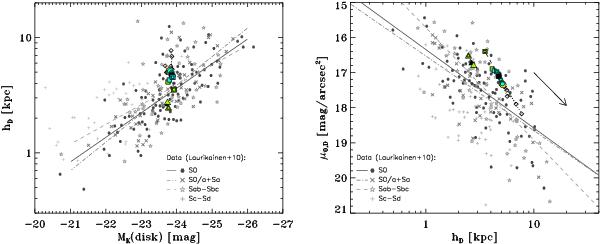
Growth vectors in the hD-MK(disk) (left) and μ0,D-hD (right) planes driven by our minor merger experiments, compared to real data. The straight lines represent the best fits for S0s (solid lines), S0/a+Sa (dotted-dashed lines), and Sab-Sbc galaxies (dashed lines) obtained by L10, which all have statistically significant rank correlation coefficients. The arrow in the right panel indicates the slope of the trend drawn by the merger models in the plane. Consult the legend for the observational data in the figure. The legend for the models is the same as in Fig. 1.
Current usage metrics show cumulative count of Article Views (full-text article views including HTML views, PDF and ePub downloads, according to the available data) and Abstracts Views on Vision4Press platform.
Data correspond to usage on the plateform after 2015. The current usage metrics is available 48-96 hours after online publication and is updated daily on week days.
Initial download of the metrics may take a while.