Fig. 2
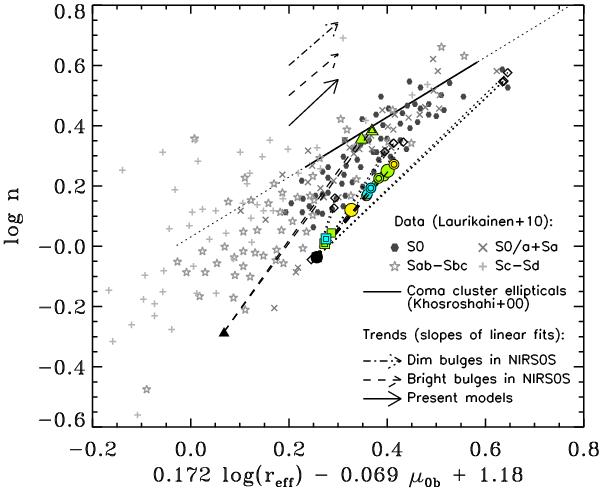
Growth vectors in the photometric plane of the bulges (which relates the three bulge parameters: n, μeff, and reff) driven by our merger experiments, compared to the observational distributions of S0s and spirals by L10. The dashed and dotted-dashed arrows indicate the trends observed by L10 for bright (MK(bulge) < −22.7 mag) and faint bulges (MK(bulge) > −22.7 mag) of the S0s in the NIRS0S survey. The solid arrow marks the trend found in our models. Consult the legend for the observational data in the figure. The legend for the models is the same as in Fig. 1.
Current usage metrics show cumulative count of Article Views (full-text article views including HTML views, PDF and ePub downloads, according to the available data) and Abstracts Views on Vision4Press platform.
Data correspond to usage on the plateform after 2015. The current usage metrics is available 48-96 hours after online publication and is updated daily on week days.
Initial download of the metrics may take a while.