Fig. 5
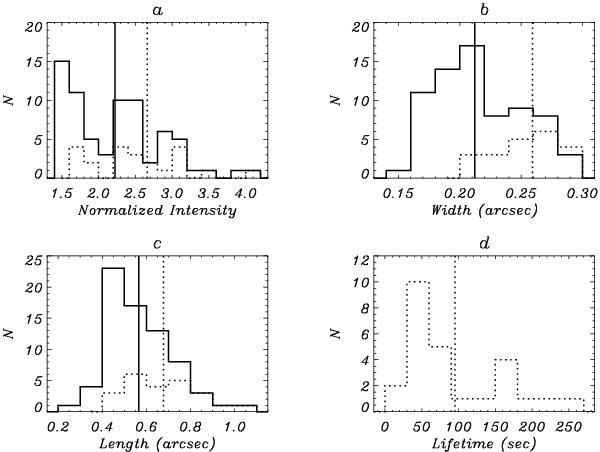
Histograms of various parameters of the identified jets. Solid lines: histogram of all values determined from each snapshot (i.e. each jet counts multiple times), dashed lines: histogram of maximum values revealed by each jet (i.e. each jet is counted once). a) normalized intensity; b) width; c) length; d) lifetime. The vertical line indicates the mean value.
Current usage metrics show cumulative count of Article Views (full-text article views including HTML views, PDF and ePub downloads, according to the available data) and Abstracts Views on Vision4Press platform.
Data correspond to usage on the plateform after 2015. The current usage metrics is available 48-96 hours after online publication and is updated daily on week days.
Initial download of the metrics may take a while.